Twitter Analytics
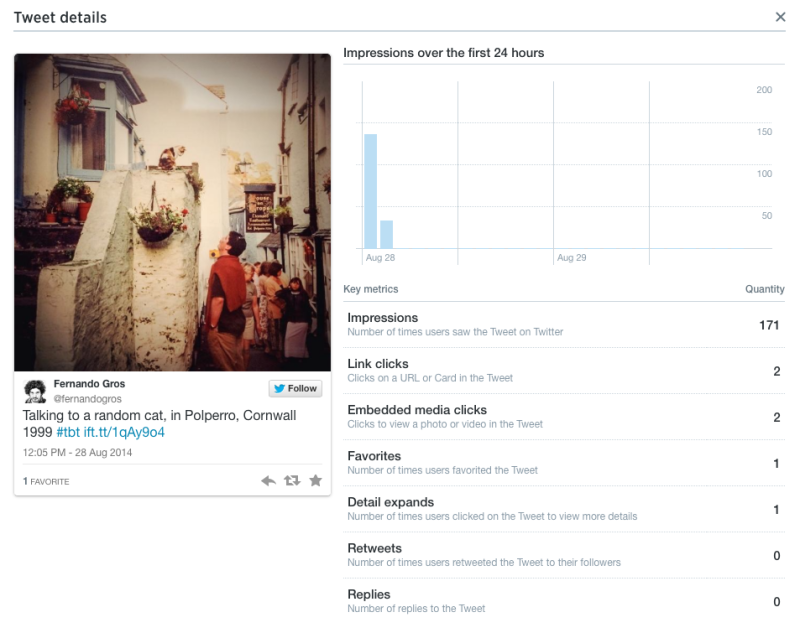
Today Twitter opened up its analytics dashboard (Twitter users can find it here). Previously, the dashboard was only available to selected advertisers and marketers, but now all Twitter users can pour over the statistical details of their tweets, to their heart’s content. The photo above was from a tweet I shared today, about an hour […]

Today Twitter opened up its analytics dashboard (Twitter users can find it here). Previously, the dashboard was only available to selected advertisers and marketers, but now all Twitter users can pour over the statistical details of their tweets, to their heart’s content.
The photo above was from a tweet I shared today, about an hour after I posted it, showing some of the key data tracked by Twitter Analytics. To be honest, the responses to an iPhone snapshot of a 15 year old photo are not really all that important to me and, I suspect in the same way, Twitter Analytics will not be all that interesting to most Twitter users.
But, if you are using Twitter to try and share something with intent, maybe notifying your followers of new blogposts, or drawing attention to upcoming events (like shows, or album or book launches), then the figures might well be helpful and worth exploring (Twitter have a guide to the analytics here).
The immediate thing that jumped out to me was how spiky my stats were. There’s some pretty consistent numbers for most of my tweets, in terms of impressions, retweets and engagement. But, when a tweet attracts more attention, it isn’t a case of a little more, or even double the traffic, it’s massively more, ten, twenty times more. It’s a trend I see with this blog as well. Most days and most posts, the traffic is the same. But, when an article starts to get noticed, the spike in traffic is huge.
I guess this is something most of us have known for some time; on the internet growth is seldom, if ever, incremental.


